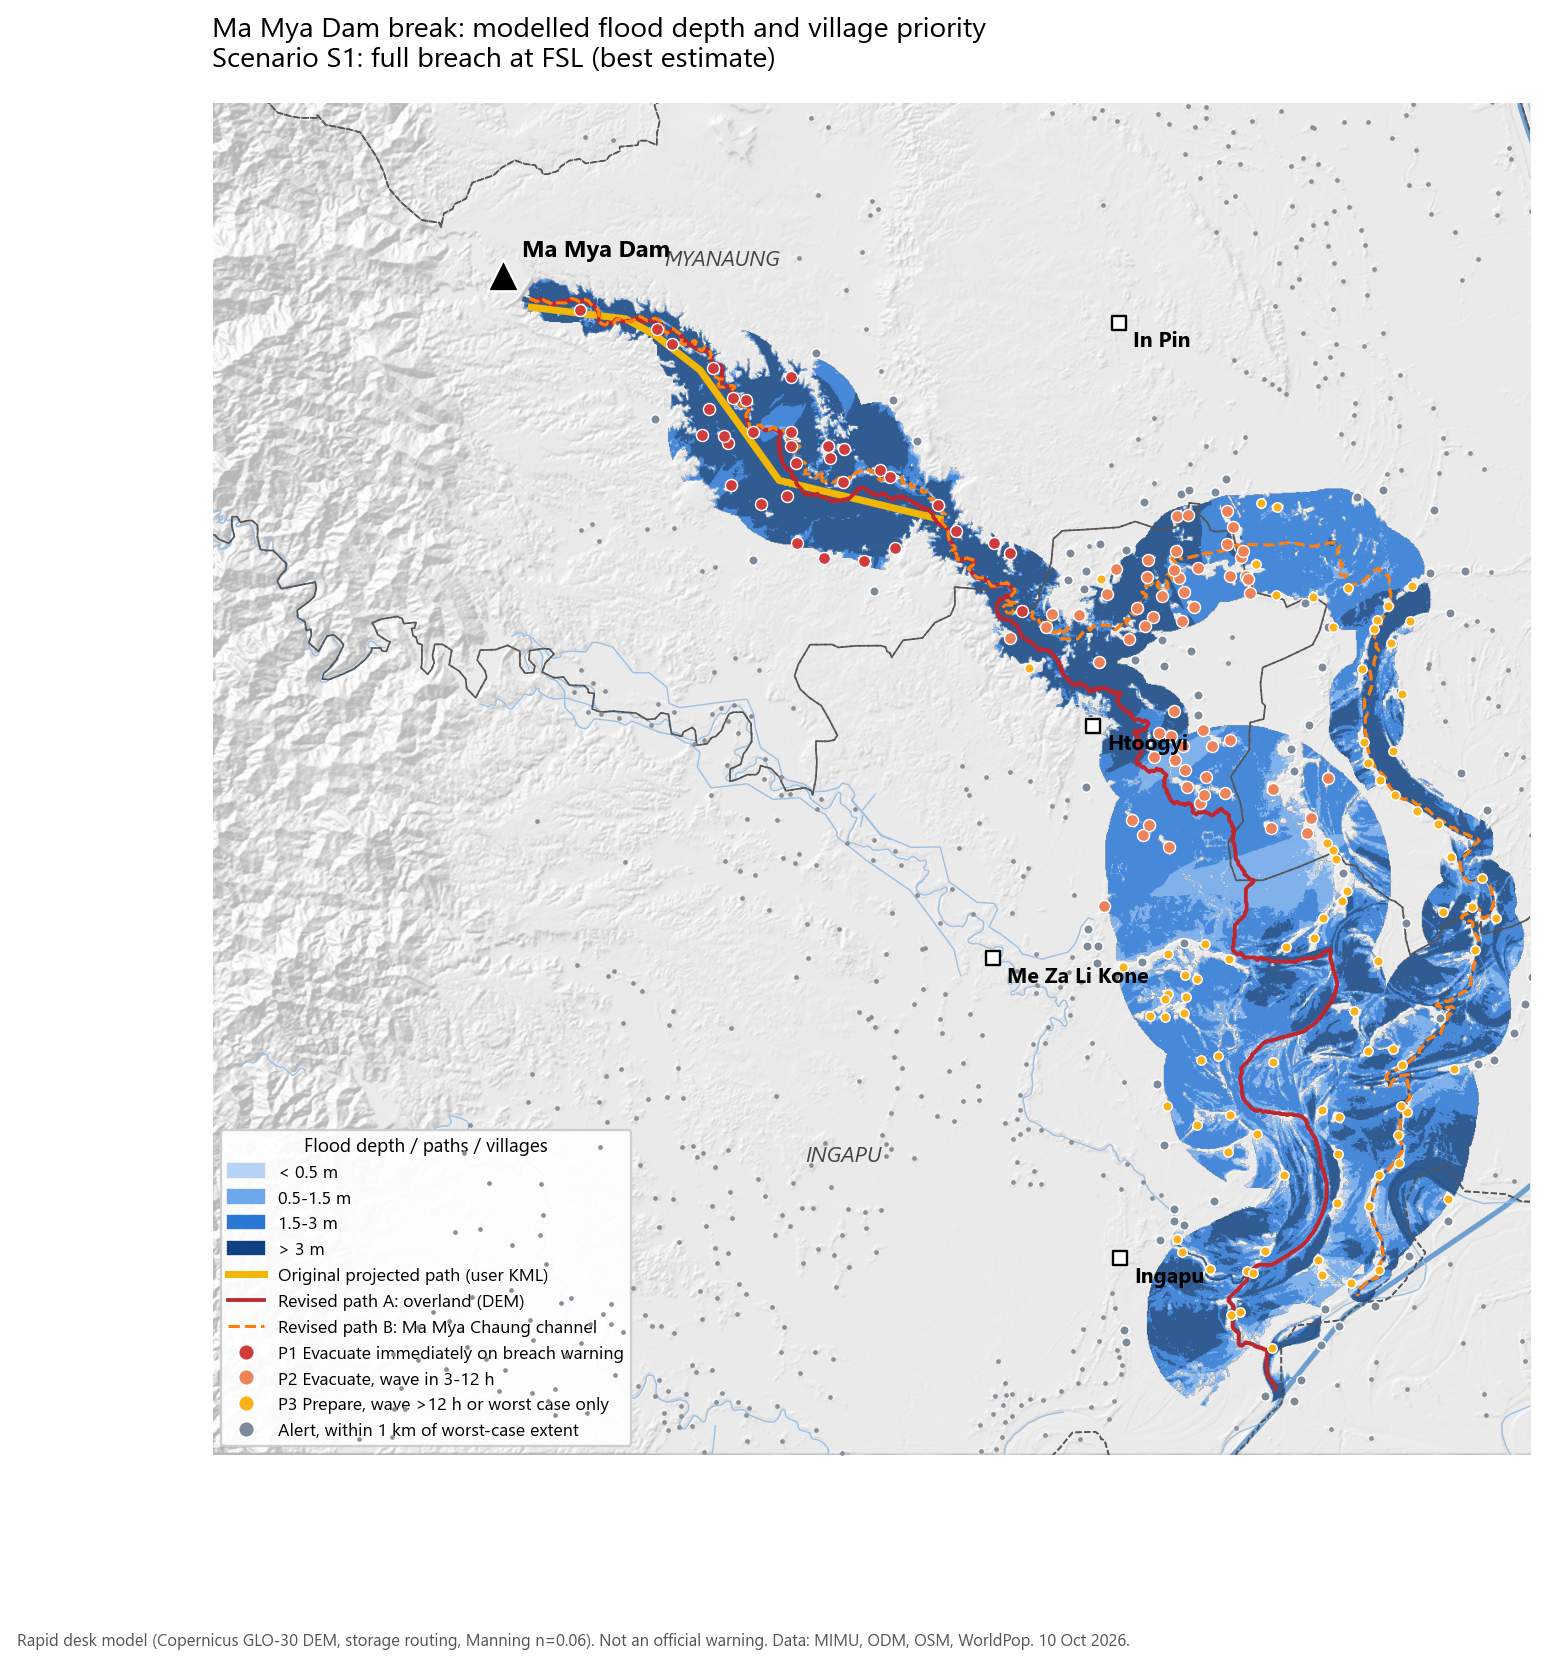
The original path stops about 50 km short
The projected path in ယူဆ ရေလမ်းကြောင်း.kml is a 16.6 km line from the dam to the point where the Ma Mya valley opens onto the plain (95.21° E, 18.03° N). Tracing water over the Copernicus 30 m terrain model confirms its alignment: the traced flow line stays within 0.3 km of it on average, and never more than 0.7 km.
The water does not stop where the valley ends. Beyond that point the ground keeps falling south-east towards the Ngawun (Pathein) River, which the flood reaches near Ingapu after another 55 to 70 km. The plain splits the flow two ways, and both are mapped:
- Branch A, overland (solid line). The steepest route over the terrain. It leaves the creek near Htoogyi and runs south through the low paddy basin west of the creek, passing Htoogyi and the eastern edge of Ingapu town.
- Branch B, Ma Mya Chaung channel (dashed line). Follows the creek as mapped in OpenStreetMap: east past In Pin, then south to the Ngawun.
Each branch is modelled as if it carried the whole flood. That is deliberately cautious: in reality the flow will divide, and the split depends on embankments, roads and canals that a 30 m terrain model cannot see.
| Path | Length km | Mean off. km | Max off. km | Original covers |
|---|
Breach outflow and scenarios
The Open Development Mekong dam inventory (from Department of Irrigation data) lists Ma Mya at 86.38 million m³ storage at full supply level, 5.38 km² of water surface and a 3.6 km crest, completed in 2007. In the terrain model the reservoir surface sits at about 86 m and the creek bed at the dam toe at 55 m. Because the spillway is spilling, the pool is close to full; taking full supply level as 88 m gives 33 m of water above the breach floor.
Four widely used empirical equations turn volume and head into a peak outflow. Their spread is large, which is normal for dam-break estimates. The best estimate (S1) uses their median. S2 is a partial breach that erodes only to mid-height, which is plausible for a slump that is caught early. S3 takes the highest equation as an upper envelope. Froehlich (2008) puts the breach at roughly 110 m wide, forming over about 1.5 hours.
| Peak outflow, m³/s | S1 | S2 | S3 |
|---|
Travel time and attenuation along the paths
Hours count from the moment the breach starts to open. A warning given when cracking or seepage is first seen buys extra time on top of this.
Wave arrival (water up 0.3 m)
Peak discharge
The valley section is fast and dangerous. In the first 10 km water rises 3 to 7 m at more than 2 m/s, and the villages of Myin War Taung, Nga Bat Kya, Let Pan Kwin and Ma Yway Kone tracts have less than 3 hours. Once the flood spreads onto the plain it slows to about 0.5–1 m/s and its peak falls to about a fifth of the dam outflow. Water there still rises 2–5 m above normal, but the lower reaches have most of a day to move people.
Villages by evacuation priority
Priority is set from scenario S1: P1 if the wave arrives within 3 hours (or within 6 hours with more than 1.5 m depth), P2 if it arrives within 3–12 hours, P3 if later or only in the worst case. Depth is the deepest water within 150 m of the village point, because the terrain model sees treetops and roofs, not the ground inside the village. Population is a WorldPop 2020 estimate assigned to the nearest village point.
Village tracts in order of first arrival
| Village tract | Township | First arrival h | P1 | P2 | P3 | Alert | Max depth m | Est. people |
|---|
Every village at risk
| Priority | Village | Village tract | Township | Depth S1 m | Arrival S1 h | Depth S3 m | Est. people | Km from dam |
|---|
Tap a row to show the village on the map. The full table with Pcodes is in villages_at_risk.csv.
Schools, roads and bridges
| Road class (OSM) | S1 km | S2 km | S3 km |
|---|
| Facility | Name | Depth S1 m | Arrival h |
|---|
Recommended actions
- Move P1 villages before a breach, not after. With water arriving within 1–3 hours and no siren network, the 33 P1 villages in Myin War Taung, Nga Bat Kya, Let Pan Kwin, Ma Yway Kone, Htein Thay Gyi and Nyaung Chin tracts (≈ 5,700 people) should be moved to higher ground now. Elderly people, children and livestock should move first while the dam is under repair. Send people to the higher ground north and south of the valley, never across or along the creek.
- Put a watch on the embankment around the clock, with a direct alert chain. Name observers at the dam. Agree a trigger (new cracks, muddy seepage, the slump widening, water within 1 m of the crest), one phone tree, and loudspeakers or monastery bells for every P1 and P2 village.
- Warn Ingapu Township. The village file covered only Myanaung, but 106 of the villages at risk are in Ingapu, including Htoogyi, where the overland branch passes within 0.3 km of town at about 8 hours, and the eastern edge of Ingapu town at about 23 hours.
- Keep drawing the reservoir down. Every metre of drawdown reduces both the head and the volume. On the same equations, a pool 3 m lower cuts the best-estimate peak by about 16%, and 5 m lower by about 26%.
- Plan routes around the 4 bridges and ≈ 300 km of road inside the flood extent. Pre-position boats, food and medicine on the high-ground side. Treat the 96 schools inside the extent as unsafe shelters, and choose shelters outside the mapped area.
- Replace the assumptions with real data. Ask IWUMD for the crest level, full supply level, spillway capacity and current pool level, then rerun the model. If a breach happens, use Sentinel-1 radar images to map the actual flood within a day.
Method, data and limits
Steps
- Terrain and drainage. Copernicus GLO-30 DEM (4 tiles) reprojected to UTM 46N at 30 m. Depressions filled with priority-flood plus epsilon, then D8 flow directions. Dam catchment 153.6 km².
- Flow paths. Traced downstream from the dam toe until the Ayeyarwady or Ngawun River (MIMU 250k). Branch B burns the OSM Ma Mya Chaung line 20 m into the DEM.
- Breach. Froehlich (1995), MacDonald & Langridge-Monopolis (1984), USBR (1982) and Webby (1996) peak equations. Breach width and formation time from Froehlich (2008). Hydrograph: linear rise, then exponential recession that conserves the stored volume.
- Routing. Cross-sections every 500 m, 12 km wide, cut from the DEM. Strip-conveyance Manning rating with n = 0.06. Cascade of non-linear storage reaches at a 5 s time step over 48 h. Mass balance closes to within 1%.
- Mapping. Peak water levels interpolated between sections, limited to each section's wetted width and kept only where connected to the path. Depth is measured above the pre-flood water level.
- Exposure. 1,224 MIMU village points (your Myanaung file plus Ingapu, Kyangin and Hinthada from the MIMU server), MIMU schools, health facilities and bridges, OSM roads, WorldPop 2020 constrained population.
Limits to keep in mind
- The DEM is a surface model: trees, houses and embankments raise it. Small levees, road embankments and canals that steer water on the plain are missed.
- Full supply level, crest level and reservoir shape are not published. Head is inferred from the DEM, and peak-flow equations are typically uncertain by ±50%.
- Each branch carries the whole flood, and the map shows the deepest water each place sees during the event. The flooded area is not all under water at the same moment.
- On the flat lower plain, flooding fills the full 6 km half-width of the sections. The rounded edges there show where the model hits that limit and are not a true flood boundary.
- Backwater from a high Ngawun or Ayeyarwady in October is not modelled. It would raise levels in the last 10–15 km.
- Arrival times are counted from breach start. Population is a 2020 estimate.
Sources
- Village points: MIMU Pcode 9.5 via your KML and the MIMU GeoNode (boundaries, schools, health facilities, bridges, reservoirs, rivers).
- Dam data: Open Development Mekong, Myanmar dams. Irrigation figures: GNLM, "Ma Mya Dam benefiting public".
- Terrain: Copernicus DEM GLO-30 (ESA, AWS open data). Population: WorldPop 2020 constrained. Waterways and roads: © OpenStreetMap contributors.
- Situation: SH News Facebook posts, 10 October 2026 (MaMyaDam_news.docx).